
by Jassica Mendez
In 2022, video marketing isn’t just here to stay; it’s here to continue to dominate digital marketing. With more and more global viewers year after year, video marketing can serve as an excellent, versatile marketing tool. However, as with most things marketing, you may encounter challenges with post-launch monitoring. How effective is your video content, really? How much of your campaign’s success can you attribute to it, and what meaningful insights can you extract from analytics? It’s those questions we’ll help answer today by pinpointing video performance metrics that measure the success of your content.
Using video performance metrics to fuel content marketing
But before doing so, let us briefly explore just how you may use such insights. “Why” often comes before “how” in such endeavors.
If video marketing interests you, chances are very high that it serves as a key component of your content marketing strategies. But content marketing is increasingly expansive and demanding, requiring some conscious, data-driven effort.
Thankfully, you can use it to stand out, leveraging video marketing for such practices as:
- Email marketing, combining an incredibly effective marketing channel with equally effective visual content
- Building backlinks, allowing your visual content to fuel your SEO
- Social media marketing, further broadening your online presence’s reach
In combination, the two can yield demonstrable results across all customer journey phases, as Semrush visualizes them:
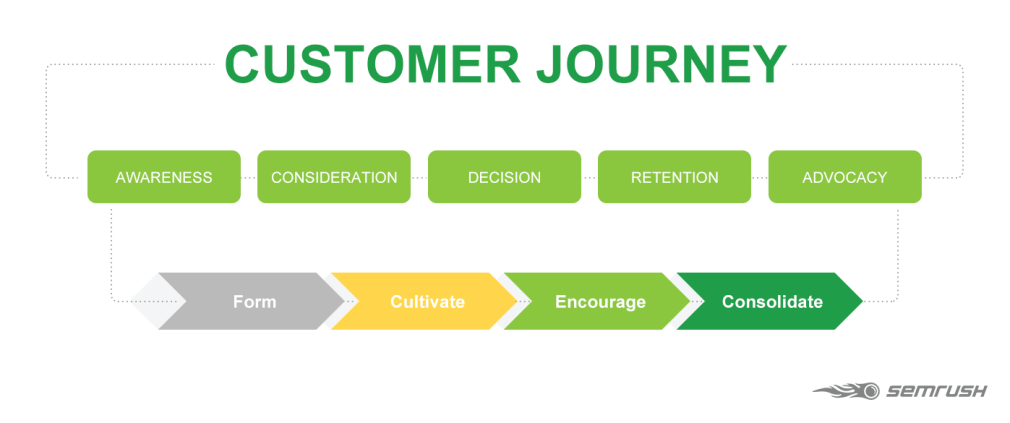
Indeed, studies find that video marketing enhances all customer journey phases, as it:
- increases website traffic (86% of respondents)
- helps generate leads (84% of respondents)
- directly helps increase sales (78% of respondents)
Reaping such benefits requires a keen eye on Key Performance Indicators (KPIs) that best gauge video content performance. Through it, you can best extract meaningful insights and optimize content marketing based on data, not hunches and gut feelings.
Video performance metrics that measure the success of your content
On that note, let’s skip further introductions and explore said KPIs in due depth. Their significance will, of course, vary based on your campaigns and goals, but the following should all hold universal value.
#1 Views
Views come among the most basic, famous, and perhaps maligned metrics out there. Views are a very simple metric in their basic form, counting how many times a video has been viewed.
Now yes, this metric’s shortcomings deserve mention first. By themselves, views arguably say very little; most marketers consider them a vanity metric now, which can at best reveal only the most basic of video marketing mistakes.
What’s more, different video-hosting and social media platforms count views differently. For some examples, consider the following among the most famous ones:
- YouTube; at least 30 seconds of viewing
- Instagram, Facebook, and Facebook Live; at least 3 seconds of viewing
- Instagram Live; a mere second into a broadcast
- TikTok; a mere second of viewing
- Twitter and LinkedIn; at least 2 seconds of viewing, with at least half the video in view
However, you can delve deeper into this metric to extract some more meaningful value. Consider such filters and factors as:
- Date ranges
- Geography
- Demographics
- Unique views and repeat views
- Viewing devices
While simple view counts may only give you a rudimentary feel for how your content is doing, digging deeper in these regards can produce some very valuable information.
#2 Watch time
Similarly, watch time is among the better video performance metrics that measure the success of your content. Unlike views, which just need to reach a set threshold to count, watch time measures the total amount of time a video has been watched.
There are a few slightly different, platform-specific ways to measure watch time, but the typical formula is the following:
Watch Time = Views x Average View Duration
For average watch time, you may instead use the following:
Average Watch Time = Total Number of Views / Total Video Watch Time
Naturally, this metric gives you a better understanding of how well your audiences receive your content. As discussed below, it’s a primary engagement metric that can help inform your efforts to entice your audiences better.
#3 Engagement
Having touched on engagement, how your audiences engage with your content may be among the most valuable metrics to monitor. Not just quantitatively gauging engagement rates but also qualitatively monitoring direct feedback.
Now, “engagement” is gauged very differently among marketers, so there’s no set formula for it. The one that typically sees use is the following, if not slight variations of it:
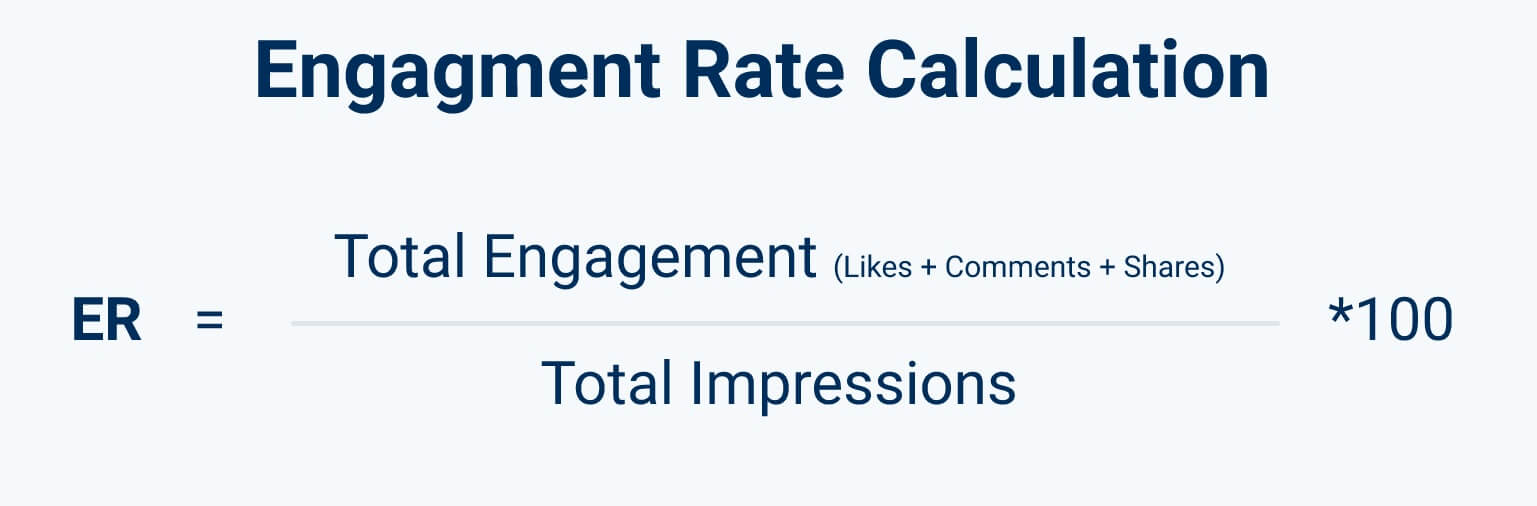
So to gauge it, you’d need to divide the number of engagements by the number of views and then multiply the result by 100 to get a percentage rate.
However, while engagement is crucial among video performance metrics that measure the success of your content, its definitions may differ. You may count likes and comments as engagement, alongside shares, for example, but you can only do so where applicable.
Depending on your marketing strategies and goals, you may also want to delve deeper into specific types of engagement. For example, brand awareness campaigns may value shares more than comments, while promotional videos may value clicks more than likes.
#4 Clicks and CTR
Speaking of campaign-specific metrics, your video marketing may very likely be seeking to generate clicks – be it for lead generation, conversions, or anything in-between. Clicks are the quintessential success metric for anything that isn’t simple brand awareness.
This metric will typically be crucial to PPC campaigns, where your video needs to entice audiences to click your CTA. For this reason, it’s thankfully easy to track; your PPC provider will typically count clicks. For Click-Through Rates (CTR), if they don’t, you may use a simple formula:
CTR = Total Clicks / Number of Impressions x 100
However, different contexts may require slightly different formulas. For email marketing click rates, for example, CampaignMonitor suggests the following instead:

That’s because, in the context of email marketing specifically, only delivered emails can even have a chance to get clicks. Including bounces in the formula can only muddle the final result.
In all cases, monitoring clicks and CTR is indeed crucial. Visible shortcomings in these metrics may often further highlight the need to optimize your content or its accompanying CTAs.
#5 Conversion rates
Finally, for any conversion-minded content, conversions and conversion rates are the most significant video performance metrics that measure the success of your content. Since you’ve defined conversions as your expected successful outcome, there are no better metrics to track here.
However, how you define conversions might differ. For reference, Google Analytics identifies two distinct conversion types:
- Micro conversions, desirable actions like signups and media engagement
- Macro conversions, transactional (i.e., completed purchases)
Then, it also identifies four conversion groups:
- Acquisition
- Inquiry
- Engagement
- Revenue
To make matters slightly worse, different types of video content might be harder to attribute conversions to – as noted above. You may, for example, gauge Facebook video ad conversion rates through a simple formula:
Conversion Rates = Number of Conversions / Number of Impressions x 100
But for educational content, for instance, you may find attribution harder. You will typically need to rely on tracking and UTM tags for that, as SproutSocial explains.
Still, there should be no question that conversion rates are a fundamental KPI to track for most video content. Measuring how your video marketing affects your bottom line is invaluable and leaves very little room for speculation. If conversion-minded content doesn’t convert, optimizations are no doubt in order.
In closing
To summarize, the most vital video performance metrics that measure the success of your content are, arguably, views, watch time, engagement, CTR, and conversions. They will help gauge your videos’ performance in meaningful, actionable ways that can inform your content marketing strategies. How you define, track, and prioritize each will almost inevitably differ, but they all hold near-universal value. Especially with a proper, campaign-specific analytical lens, these KPIs can shed ample light on how your content resonates with audiences.